Manual for STEPanizer final version1
Stefan Tschanz, MD, Software Eng., Institute of Anatomy, University of Bern
Email: tschanz@ana.unibe.ch
Web Address: http://www.STEPanizer.com
Please read the actualized instructions on the STEPanizer front side carefully!
Content
1 Basic ideas behind the STEPanizer
2.1 Abbreviations/explanations:
3 Image acquisition and saving requirements
4 Work flow of the STEPanizer (Quick guide)
7.2 Recognition of points / intersections
7.3 Controls of the COUNTING Window
Figure index
Fig. 9 a & b: Point test system
Fig. 10 a & b: Line-pair test system
Fig. 13 COUNTING Window in CHECK mode
Fig. 14: Info Field of PARAMETER Window
Fig. 19 Controls of the COUNTING Window
1 Basic ideas behind the STEPanizer
STEPanizer enables you to fulfill a variety quantification tasks based on stereologic approaches. It allows you to design a test system according to your needs. Your digital images are consecutively read from local disk and displayed on the computer screen with the test system superposed. The stereologic hit events of the test system with the structures of interest are assessed by eye and the counts recorded within STEPanizer, typing a dedicated key on the numerical keypad.
STEPanizer allows to scale-in the real size of an image by measuring a scale bar on the image. You will get the real size of a pixel of the displayed image and the real distance from one test system item to the other.
STEPanizer saves automatically its properties (test system, paths, color of test system and intermediate results) on a binary (not readable) local file which allows to restart in the same state as after a voluntary stop or crash of the program. Results are exported as MS Excel tabloid text file (readable with other spreadsheet programs too).
STEPanizer is a web-based JAVA Applet, which starts within your browser. It needs the JAVA runtime environment to be installed on your computer including the browser plug in. JAVA Version has to be 1.5 or higher. Actually a known bug in JAVA JRE versions 1.6 from update 7 (1.6.0_7) to update 11 (1.6.0_11) prevents the saving of STEPanizer parameters.
Please install the Java version >1.6.0_12 (http://java.com/download ), or any version from 1.5 to 1.6.0_6.
STEPanizer works with Microsoft Internet Explorer 5 or higher, Firefox 2 or higher and Safari on Microsoft Windows, Linux and MAC operating systems, respectively.
2 How to read this manual
The scientific concept of STEPanizer and its stereologic foundation will soon be subject of a separate publication. This document should help to use STEPanizer and gives step-by-step instructions.
Names written in courier font, bold and red indicate control elements on the STEPanizer graphical user interface (GUI)
![]() Values typed into
or produced by the STEPanizer GUI are formatted in times bold.
Values typed into
or produced by the STEPanizer GUI are formatted in times bold.
On the print screens of the GUI, spots of interest are surrounded by colored rectangles and arrows, not present on the original user interface.
The electronic version of this document (html) contains underlined hyperlinks to referenced parts within the document. In the html web-document many print screens of the STEPanizer GUI have also mapped areas (e.g. buttons) linking to the explaining text. In such cases the mouse cursor turns into link form (small hand) if positioned over such a hyperlink.
2.1 Abbreviations/explanations:
· OS: operating system
· GUI: graphical user interface
· numpad: numerical key pad with keys 1 to 9, mostly at the right side of a standard keyboard
· default directory: depending on the OS this can be located at different paths, e.g. c:\user\myName (win7), c:\Document and Settings\myName (winXP), /user/home (Linux & MAC)
3 Image acquisition and saving requirements
· Capture digital images in landscape
· Capture digital images in jpeg file format
· Capture digital images in a resolution in accordance to your monitor's size, e.g. SXGA monitor (1280x1024 pixels) à images: around 1024 pixels height.
· Although STEPanizer resizes images proportionally to the chosen Monitor Resolution in the parameter setting, images should match this as stretching small images results in poor image quality and shrinking too large ones decreases load speed dramatically. In cases with high-resolution capturing devices with huge image output (3000x4000 pixels) the latter situation could be resolved by using a binning mode during acquisition or to batch-resize the images by means of a simple freeware imaging program like IrfanView and its batch extension.
· Add a calibrated ruler to one of the captured images, preferably on left image part.
· Save series of images in a hierarchical manner with all images of one animal/plant/material sample in one directory. Name the files with an invariable front part ("prefix") describing the sample and an increasing number with an underscore sign in-between. Do not use a leading zero in the incremental number, e.g. sampleAA_1.jpg, sampleAA_2.jpg,…..sampleAA_35.jpg
4 Work flow of the STEPanizer (Quick guide)

Fig. 1: Work flow diagram
5 GUI controls
5.1 The STEPanizer Homepage
Please read the initial instructions and click then the STEPanizer START link:
![]()

Fig. 2: Home page
After STEPanizer is started, a warning window asks whether the STEPanizer applet can establish access to your local disk. This is necessary for loading your images and allows to save results and STEPanizer- settings. Normally Java applets in a browser window do not have read or write access to the client file system, here they need!

Fig. 3 Warning message
To avoid further warnings for this particular page, you can check the “Always trust..” (if you trust me;-))
5.2 PARAMETER Window
Allows to parameterize the STEPanizer. It contains all control buttons and input fields. If STEPanizer is closed all settings from this window are saved locally.

Fig. 4: PARAMETER Window
Description of the control elements
¨
Monitor Resolution:
vga (600x800), xga (768x1024), sxga (1024x1280), uxga (1200x1600)
▪ do not change resolution during an experiment, as calibration will be changed. If resolution is changes a warning message appears, which requests the new scaling

Fig. 5 Re-Scale warning
¨
Input fields for Image Name and Image
Path
these can be filled, by browsing the local file system: BROWSE (an Open
Image dialog box will appear), or manually
Note that at every start of a new image series (even in Batch Mode) the first image of a series must
by browsed or entered here
¨ SCALE button for calibrating images
· for scaling purposes a calibrated ruler has to be on at least one image
· opens the SCALE Window
¨ Test System Properties controls
▪ simple points (represented by a small cross): pure point counting
▪ line pairs: point and intersection counting
▪ square grid: point counting at the line crossings and intersection counting in two directions
▪ cycloids: point and intersection counting
· Nbr. of tiles: this sets the number of points, the number of line PAIRS, the number of grid lines (e.g. 3 corresponds to three horizontal plus three vertical lines) and number of cycloids.
· SubSampling: allows to add a subsampling of test items, where applicable. Sub sampling allows to have test points at two different densities with the intention to ease the assessment of structures with substantially different densities.
· Guard area: defines the distance of the counting frame border to the image border. The guard area is outside the counting area proper and allows to observe structural borders where its use is appropriate. Can be entered as number of pixels or, only after scaling, in µm.
· CHECK the arrangement of the test system on an image (a valid image name and path has to be entered with BROWSE)
¨ Overlay Appearance controls:
· Line Width: line thickness of test system elements, definable in pixels
· T-Bar: defines the size of the T-shaped endings of test lines
▪ Frame checkbox: show frame border
▪ Testsystem checkbox: show test system
▪ Circle checkbox: show circle around test line crossings to indicate the appropriate counting corner
▪ Frame: Counting frame delimiting the counting area
▪ Testsystem 1: color of main test system tiles
▪ SubSampling Circle: different color for the labels of subsampling test system items.
▪ Ring Marker: color of markers for visual labeling of counting events, see Hit labeling
▪ Quadrat Marker: color of the quadratic markers, assigned to the right mouse button clicks on the COUNTING Window, see Mouse counting
▪ All these items can be colored to give optimal contrast to the images under investigation. CHECK the appearance on an image (a valid image name and path has to be entered with BROWSE).
¨
Batch Mode controls:
In most cases series of images within a directory representing one experimental
entity (animal, plant, sample) will be analyzed in a batch. This means that the
whole image series is consecutively loaded and analyzed without going back to
the PARAMETER Window.
For this the naming of image files has to fulfill special conventions (see Image acquisition and saving
requirements), and the naming parts have to be
entered here.
Important: for Batch Mode too, the first image of a series has to be browsed with
the Open Image dialog and appear in the Image Name and Image
Path fields.
· Enable checkbox: enable the batch mode. An example of naming appears in the prefix input field
· Image name prefix input field: enter here the invariant front part of the image series ending with a underscore sign (e.g. SampledAnimal_ )
· Start#, End# input fields: Enter start number and end number of the actual image series.
· Act# field (read only): shows the actual image under investigation.
¨ Main control buttons
¨ COUNTING: Starts the COUNTING Window, where data acquisition is accomplished
¨ EXPORT: exports a text file in tabloid form. The file has a XLS ending, allowing an easy opening of it within Microsoft Excel. Its internal format is however purely textual and can be imported by any editor or spread sheet program. This result file is named with the prefix ant the date and time of its generation ("_co_day21_2010-06-10_15-49_result.xls") and saved in the folder, where the images are located. Thus one result file will be produced per experimental entity.
¨ CLOSE: Closes STEPanizer in a controlled manner. All set parameters and intermediate results are saved locally.
¨ HELP: opens this document
¨
Info Field: displays informations on the state of STEPanizer, its settings as
well as properties of the test system (see: Info Field Figure)
Reset and delete buttons below have to be used with Caution:
¨
RESET ALL & CLOSE!:
Prior to reset STEPanizer, EXPORT settings and results, if present! This button will set all setting fields to default values and
delete all intermediate results. All user actions and assessments are lost. The
StepanizerData.ser is archived and deleted.
¨
DELETE DATA!:.
Prior to delete data, EXPORT results! Preserves
all settings, but deletes all results and the file names / file paths. Set
STEPanizer to the state for a new image series / group, using the same
stereologic settings. Must be used at the beginning of a series
5.3 File handling dialog
After clicking the BROWSE button on the PARAMETER Window, the Open Image… dialog appears. It allows to search for the appropriate folders and files. On first start of STEPanizer this dialog will show the default user data folder. According to the recommendations in the section "Image acquisition and saving requirements", files of one experimental individual should be saved in one folder and labeled with an incremental number, as shown in fig. 6. Chose the first image and open it.

Fig. 6: Open Image dialog
6 Preparative steps
6.1 Scaling an image
Before scaling the STEPanizer you have to open an image file with the same magnification as in the whole experiment, containing a calibrated ruler with known width. This ruler should be somewhere on the left part of the image. After clicking the SCALE button on the PARAMETER Window, the SCALE Window opens:
![]()
![]()
![]()
![]()
![]()

Fig. 7 SCALE Window
EM image of human lung within the SCALE Window. The red arrow indicates the calibrated ruler of the image. The green rectangle shows the real size of this ruler. Size number AND ruler have to be burnt into the image preferably during image acquisition. How to go on:
1. Type the ruler size (5) into the Input Field (red rectangle)
2. With pressed left mouse button, trace with the cramp (blue) the image ruler from the beginning parallel to its length to the other end (dotted arrow). After releasing the left mouse button, STEPanizer is scaled.
3. Close this window with SCALE OK
6.2 Test system design
Back on the PARAMETER Window the test system properties have to be set in the Test System Properties section in accordance to the stereologic project, including the definition of a counting frame where appropriate. In addition, colors of the test system elements, frame and labeling signs have to be set allowing optimal contrast and identification.
6.3 Counting frame
STEPanizer allows the creation of a counting frame with a guard area outside and the counting area proper inside. The frame consists of inclusion lines and forbidden lines. Such a frame is depicted on the COUNTIG Window (Fig. 13) in black or in red on the figure below. The Width of the Guard Area is set on the PARAMETER Window in pixels or (after scaling) in µm. In some situations a guard area is needed for better classification of tissue components at the image border, i.e. to allow the inspection of the zone around the counting area edges. Forbidden and inclusion lines of the frame define a unbiased counting frame, where this feature is required. For details using the counting frame see the stereologic literature.
If no edge problems are present and no unbiased counting frame is required, the Guard Area width can be set to 0.
![]()

Fig. 8: Counting frame
Pink double arrow indicates the guard area width.
This figure shows clearly that STEPanizer uses always a quadratic field of analysis. The maximal height of the quadrat corresponds to the height of the image, whereas parts of the image on the right side of the quadrat are ignored.
6.4 Test systems
6.4.1 Points
![]()
![]()


Fig. 9 a & b: Point test system
Here a so called basic tile consists of one point. The Nbr. of tiles setting corresponds to the number of points. In (b) the same point density but with a 1:4 subsampling. The point with the blue circle is a coarse point and has a 4 times lower density (i.e. represents the 4 times higher area). Subsampling is available as 1:4, 1:9 and 1:16 relation, but naturally only, when the total point number is divisible by the relation.
6.4.2 Line pairs
![]()
![]()


Fig. 10 a & b: Line-pair test system
Lines can only be used as pairs. One basic tile consists always of two lines and 4 points, at the ends of the lines. The Nbr. of tiles setting corresponds to the number of line-pairs. In (b) a subsampling system with 1:4 ratio is shown. Line pairs allow only 1:4 subsampling.
6.4.3 Grids

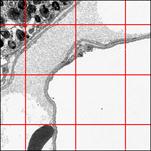
Fig. 11: Grid test system
The basic tile of a grid test system is a
point at the crossing of two lines spanning vertically and horizontally through
the whole tile (dotted blue quadrat) . The Nbr. of tiles setting
corresponds to the number of such crossings. The whole Fig. 11 depicts therefore 9 basic tiles. The
number of lines is ![]() . No subsampling available.
. No subsampling available.
6.4.4 Cycloids
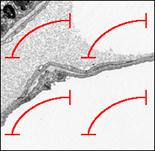
Fig. 12: Cycloid test system
For vertical section sampling designs sine-weighted lines have to be used. Cycloids are such lines. The Nbr. of tiles setting corresponds the number of single lines with two end points. No subsampling available.
6.5 Checking the test system
All settings just defined must be checked prior to use them for counting. Clicking on the CHECK button opens the COUNTING Window with full test system appearance but without counting possibility.
It's the moment to assign the counting keys (keys of the numerical key pad) to the structural items to be assessed (see next section)
![]()

Fig. 13 COUNTING Window in CHECK mode
COUNTING Window with a line pair test system over a EM image of human lung. Note the Info Panel, where the red rectangle indicates the CHECK mode. In this example a line-pair test system with 1:4 subsampling is shown. The blue circles indicate a coarse point which is in a 1 to 4 relation to all points.
After closing the COUNTING Window in CHECK mode, information on the test system properties can be examined in Info Field of the PARAMETER Window:

Fig. 14: Info Field of PARAMETER Window
6.6 Assignment of keys
Using STEPanizer means to count hit events of test system elements (point counts, intersection counts) with structural components of interest. The matching hit events are recognized by eye and the counts registered by pressing a previously assigned key 1 to 9 on the numerical key pad (numpad. For better survey these keys can be named, e.g. point on air (à P air), intersection on epithelial border (à I ep).
This can be done on the COUNTING Window preferably during CHECK of the test system.
![]()
![]()


![]()
![]()


Fig. 15: Hit-Table
On the left part of the COUNTING Window are located the controls of this window
How to assign names to key:
1. Enter the first parameter name (e.g. P air) into the Input field
2. Click on Edit Name Parameter 1
3. The name is transferred into the Hit-Table to the Structure column at the Num 1 line. Edit Name Parameter button changes its number to 2
4. Enter next structure name into the Input field
5. Click on Edit Name Parameter 2
….and so one
For editing purposes, toggle to the appropriate Edit Name Parameter x by consecutively clicking on it, edit the name in the Input field, and click the button once more. For clearing a Structure name, delete the letters in the Input field with CLEAR before clicking on the corresponding Edit Name Parameter x.
Values entered into the Structure column of the HIT-Table remain saved until calling RESET ALL & CLOSE!, even after DELETE DATA! call.
7 Counting procedure
After the STEPanizer is (1)scaled, the (2)test system designed, (3)colored and (4)tested, the (4)num keys assigned, the counting proper can be started. It is recommended to use the Batch Mode (see there) for sequential working on a whole image series. Not using this will force you to always close the COUNTING Window and browsing for the next image with the Open Image dialog.
By clicking on the COUNTING button in the PARAMETER Window the COUNTING Window is opened with counting feature enabled.
7.1 How to count?
It is recommended to follow in a meander like manner each line of points / lines from top to bottom and to click on the assigned numpad key when the corresponding point/line to structure hit appears. We normally track with a finger the pathway of the analysis.
Fig. 16: How to count

![]()


The finger indicates a "Point" lying on a lung epithelial cell type 2. Therefore the key "4" assigned to this component has to be pressed once. The number in the Actual column of the Hit-Table increases by 1 in the Num4 à "P epithelia 2" line. In addition the number in the Total column increases.
7.2 Recognition of points / intersections


![]()
![]()
![]()

Fig. 17: Point definition
Points are defined as corners of the crossing of horizontal and vertical lines of the test system.
Please use exactly the corner (yellow arrow) and not the line-crossing itself. The crossing of the lines represents itself a small area (orange) and is NOT a clearly defined point. However, the corner is exactly an infinite small point and allows to better and unambiguously recognize the structure underneath.

![]()
![]()
![]()
![]()
![]()
![]()

Fig. 18: Intersections
Intersection counts are defined as intersects of test system lines with a structural border (i.e. structure profile border on the section). Take the whole line from the left to the right T-Bar corner (black dotted arrow) and the upper side of the line. On this example of an interalveolar lung septum the two green arrows indicate two counts for the air-epithelium interface.
7.3 Controls of the COUNTING Window
The name of the control buttons may change according to the state of the COUNTING Window.

Fig. 19 Controls of the COUNTING Window
The CLEAR button deletes the letters in the Input Field. The Delete Marks button deletes all Ring Markers (see Hit labeling) and Quadrat Markers (see Mouse counting) on the actual image.
Deleting the Ring Markers does not touch the counted hits (this has to be done with the numpad keys, see Count errors).
Deleting the Quadrat Markers also deletes the associated mouse counts in the Hit-Table.
During counting the CLOSE button turns into SAVE&CLOSE. Clicking on it will show the following warning:

Fig. 20: Image Close Warning
Clicking on YES will close the image and save its data column in the Hit-Table. If it's answered by NO, the counts of the actual image are cleared before the image is closed. This image has to be re-assessed. SAVE&CLOSE is therefore a way to voluntary interrupt an assessment.
During Batch Mode clicking the SAVE&NEXT button ends the assessment of the actual image, saves its column and re-opens the next image directly. This goes on, until the End# (number) of the particular batch job is reached. If a batch job has to be interrupted before its end this can be handled by clicking SAVE&CLOSE. Whether or not the last image was assessed completely the confirmation (Fig. 20) has to be answered accordingly. At the next COUNTING start from the PARAMETER Window or the entire restart of STEPanizer the position within the last batch job is remembered and counting can be continued.
7.4 Count errors
If during counting a numpad key is pressed too much, such an error can easily be corrected by combined pressing the Alt or AltGr key with the involved numpad key as often as this key was pressed too much.
![]()
![]()
![]()

Fig. 21: Count errors
If a whole image of a series has to be reevaluated, the actual counting can be interrupted, by clicking SAVE&CLOSE and answering the warning dialog by NO.
If an image's assessment is found to be incorrect after it's saving, it's recommended to continue the actual batch job until its end. Then reload the particular image manually and record the hits. As each column of the result file has the name of the corresponding image file at its bottom, it is unproblematic to edit later the spreadsheet and delete the incorrect column (see Export section).
7.5 Hit labeling
Instead of tracking the count procedure with the finger (Fig. 16), the mouse cursor can be used for this. As additional help, this will print a numbered circle (Ring Marker) at the position of the mouse cursor when simultaneously a numpad key is pressed. The number next to the circle corresponds to this key. The color of these marks is defined by the Ring Marker setting on the PARAMETER Window.


Fig. 22: Hit labeling
Doted dark blue arrow: way of the mouse cursor. During this track, the appropriate numpad key was pressed simultaneously and a pink Ring Marker with the corresponding key number printed on the screen. Note, that at the top row, no P air (key 1) was registered: air is only counted if it's hit by a coarse point (blue circle). 1: air, 2: capillary, 3: epithelium type 1, 4: epithelium type 2
These Ring Markers are only transient on the actual image and are deleted at every image change. Naturally, the count itself is saved! By clicking on the Delete Marks button of the COUNTING Window (see Controls of the COUNTING Window), all actual Ring Markers are deleted, preserving the counts.
The use of this feature is definitely optional. It may help to discuss and analyzed image during the launch of a new experiment. From our experience we do not use it during real assessment of image series.
7.6 Mouse counting
The 10th parameter of the Hit-Table is assigned as a mouse click counter. At the actual position of the mouse cursor a quadrat (Quadrat Marker) is printed with an increasing number when the left mouse button is clicked. This number is also added to the Mouse line of the Hit-Table. The color of the marker is defined by the Quadrat Marker setting on the PARAMETER Window. By clicking on the Delete Marks button of the COUNTING Window, all actual Ring Markers are deleted, preserving the counts, too.
![]()
![]()

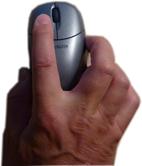
Fig. 23: Mouse counter
Counting septal tips of lung parenchyma.
Please be aware, that counting profiles is not a measure of their number in 3D!
8 Data export
Data assessed with the STEPanizer just consists of points and intersection hit counts. Further calculation is in the responsibility of the user. Applying standard stereologic formulas on these basic counts allows easy calculation of volume and surface densities and, multiplied by absolute volumes, the absolute values (see literature about stereology).
STEPanizer data is available as tabular text file which is readable by any spreadsheet program. The default file association is Microsoft's Excel and clicking on the result file opens it in Excel. The format of the table is shown in Fig. 24. The export file is always saved in the same folder where the image or image series is located. Hence, one export file should contain the counts of a whole image series. If the instructions regarding image saving are followed (see Image acquisition and saving requirements) each folder comprises though the image data AND the stereologic counts for one experimental entity. The file name consists of the image name prefix, followed by the date and time of saving, e. g. _Human_19y_2010-07-01_09-18_result.xls.
Repeated saving of the same image series does not increment the export file's content, but saves always a new file (easily recognizable by its date/time part of the file name).
 |
![]()

Fig. 24: Export file
Parts in yellow indicate the parameter assignment. The red part is the result part proper. The header of the column (I_1, I_2…) specifies to the image of the series. The red rectangle highlights the image information field, containing the image name and the exact date of hit counting. The green field contains all informations on the test system and calibration.
The sum values in the Total column and the Sum line are not defined as formula fields. If a column has to be deleted (e. g. a re-assessed image), these sums are not adapted. For further calculation it is therefore strongly recommended to copy the raw count data (red part, columns I_1 to I_x) to a new table. Add there all required calculation fields.
9 Persistency
Settings and results of the STEPanizer are saved in a binary file, located in the user's default directory within the folder .javastereo. This file called StepanizerData.ser is formatted as Java serialized data, not meant to be assessed and edited. It is designed as hidden file and typical OS settings prevent the folder and the file from being visible. StepanizerData.ser is created whenever the user operates or closes STEPanizer. Every image change during data acquisition, saves the actual data and settings to the file. The RESET ALL & CLOSE on the PARAMETER Window brings the STEPanizer back to default values. The actual StepanizerData.ser file is renamed with the date of change (e.g. StepanizerData.ser_2010-07-01_11-45), backuped in the .javastereo folder and no more accessible. During the next operation of STEPanizer a new file will be produced. In rare cases of data loss, the backuped file can be renamed to StepanizerData.ser and STEPanizer restarts with former settings.[1]
10 Literature
· Baddeley, A.J., H.J. Gundersen, and L.M. Cruz-Orive, Estimation of surface area from vertical sections. J Microsc, 1986. 142(Pt 3): p. 259-76 (PubMed link).
· Gundersen, H.J., Estimators of the number of objects per area unbiased by edge effects. Microsc Acta, 1978. 81(2): p. 107-17 (PubMed link).
· Howard, C.V. and M.G. Reed, Unbiased Stereology: Three-Dimensional Measurement in Microscopy. Microscopy handbook. Vol. 41. 1998: BIOS Scientific Publishers).
· Hsia, C.C., et al., An official research policy statement of the American Thoracic Society/European Respiratory Society: standards for quantitative assessment of lung structure. Am J Respir Crit Care Med, 2010. 181(4): p. 394-418. (PubMed link).
· Weibel, E.R., Volume I. Stereological Methods. Practical methods for biological morphometry. Academic Press, London, 1979: p. 1-415.
· Weibel, E.R., C.C. Hsia, and M. Ochs, How much is there really? Why stereology is essential in lung morphometry. J Appl Physiol, 2007. 102(1): p. 459-67(PubMed link).
· Tschanz SA, Burri PH, Weibel ER, A simple tool for stereological assessment of digital images: the STEPanizer. J Microsc. online: Mar 2011 (PubMed link).